Datadog
Problem
During incidents, developers had to manually reconstruct causality across hundreds of signals and multiple products. Watchdog could detect and relate anomalies, but its early output was a dump of correlated graphs. The Applied AI team (then just Data Science) surfaced interesting signals, but not a story engineers could easily act on.
Design challenge
I initially approached it as a visualization problem. I designed a node-based view of related services and anomalous endpoints, paired with aligned time-series graphs in a side panel.
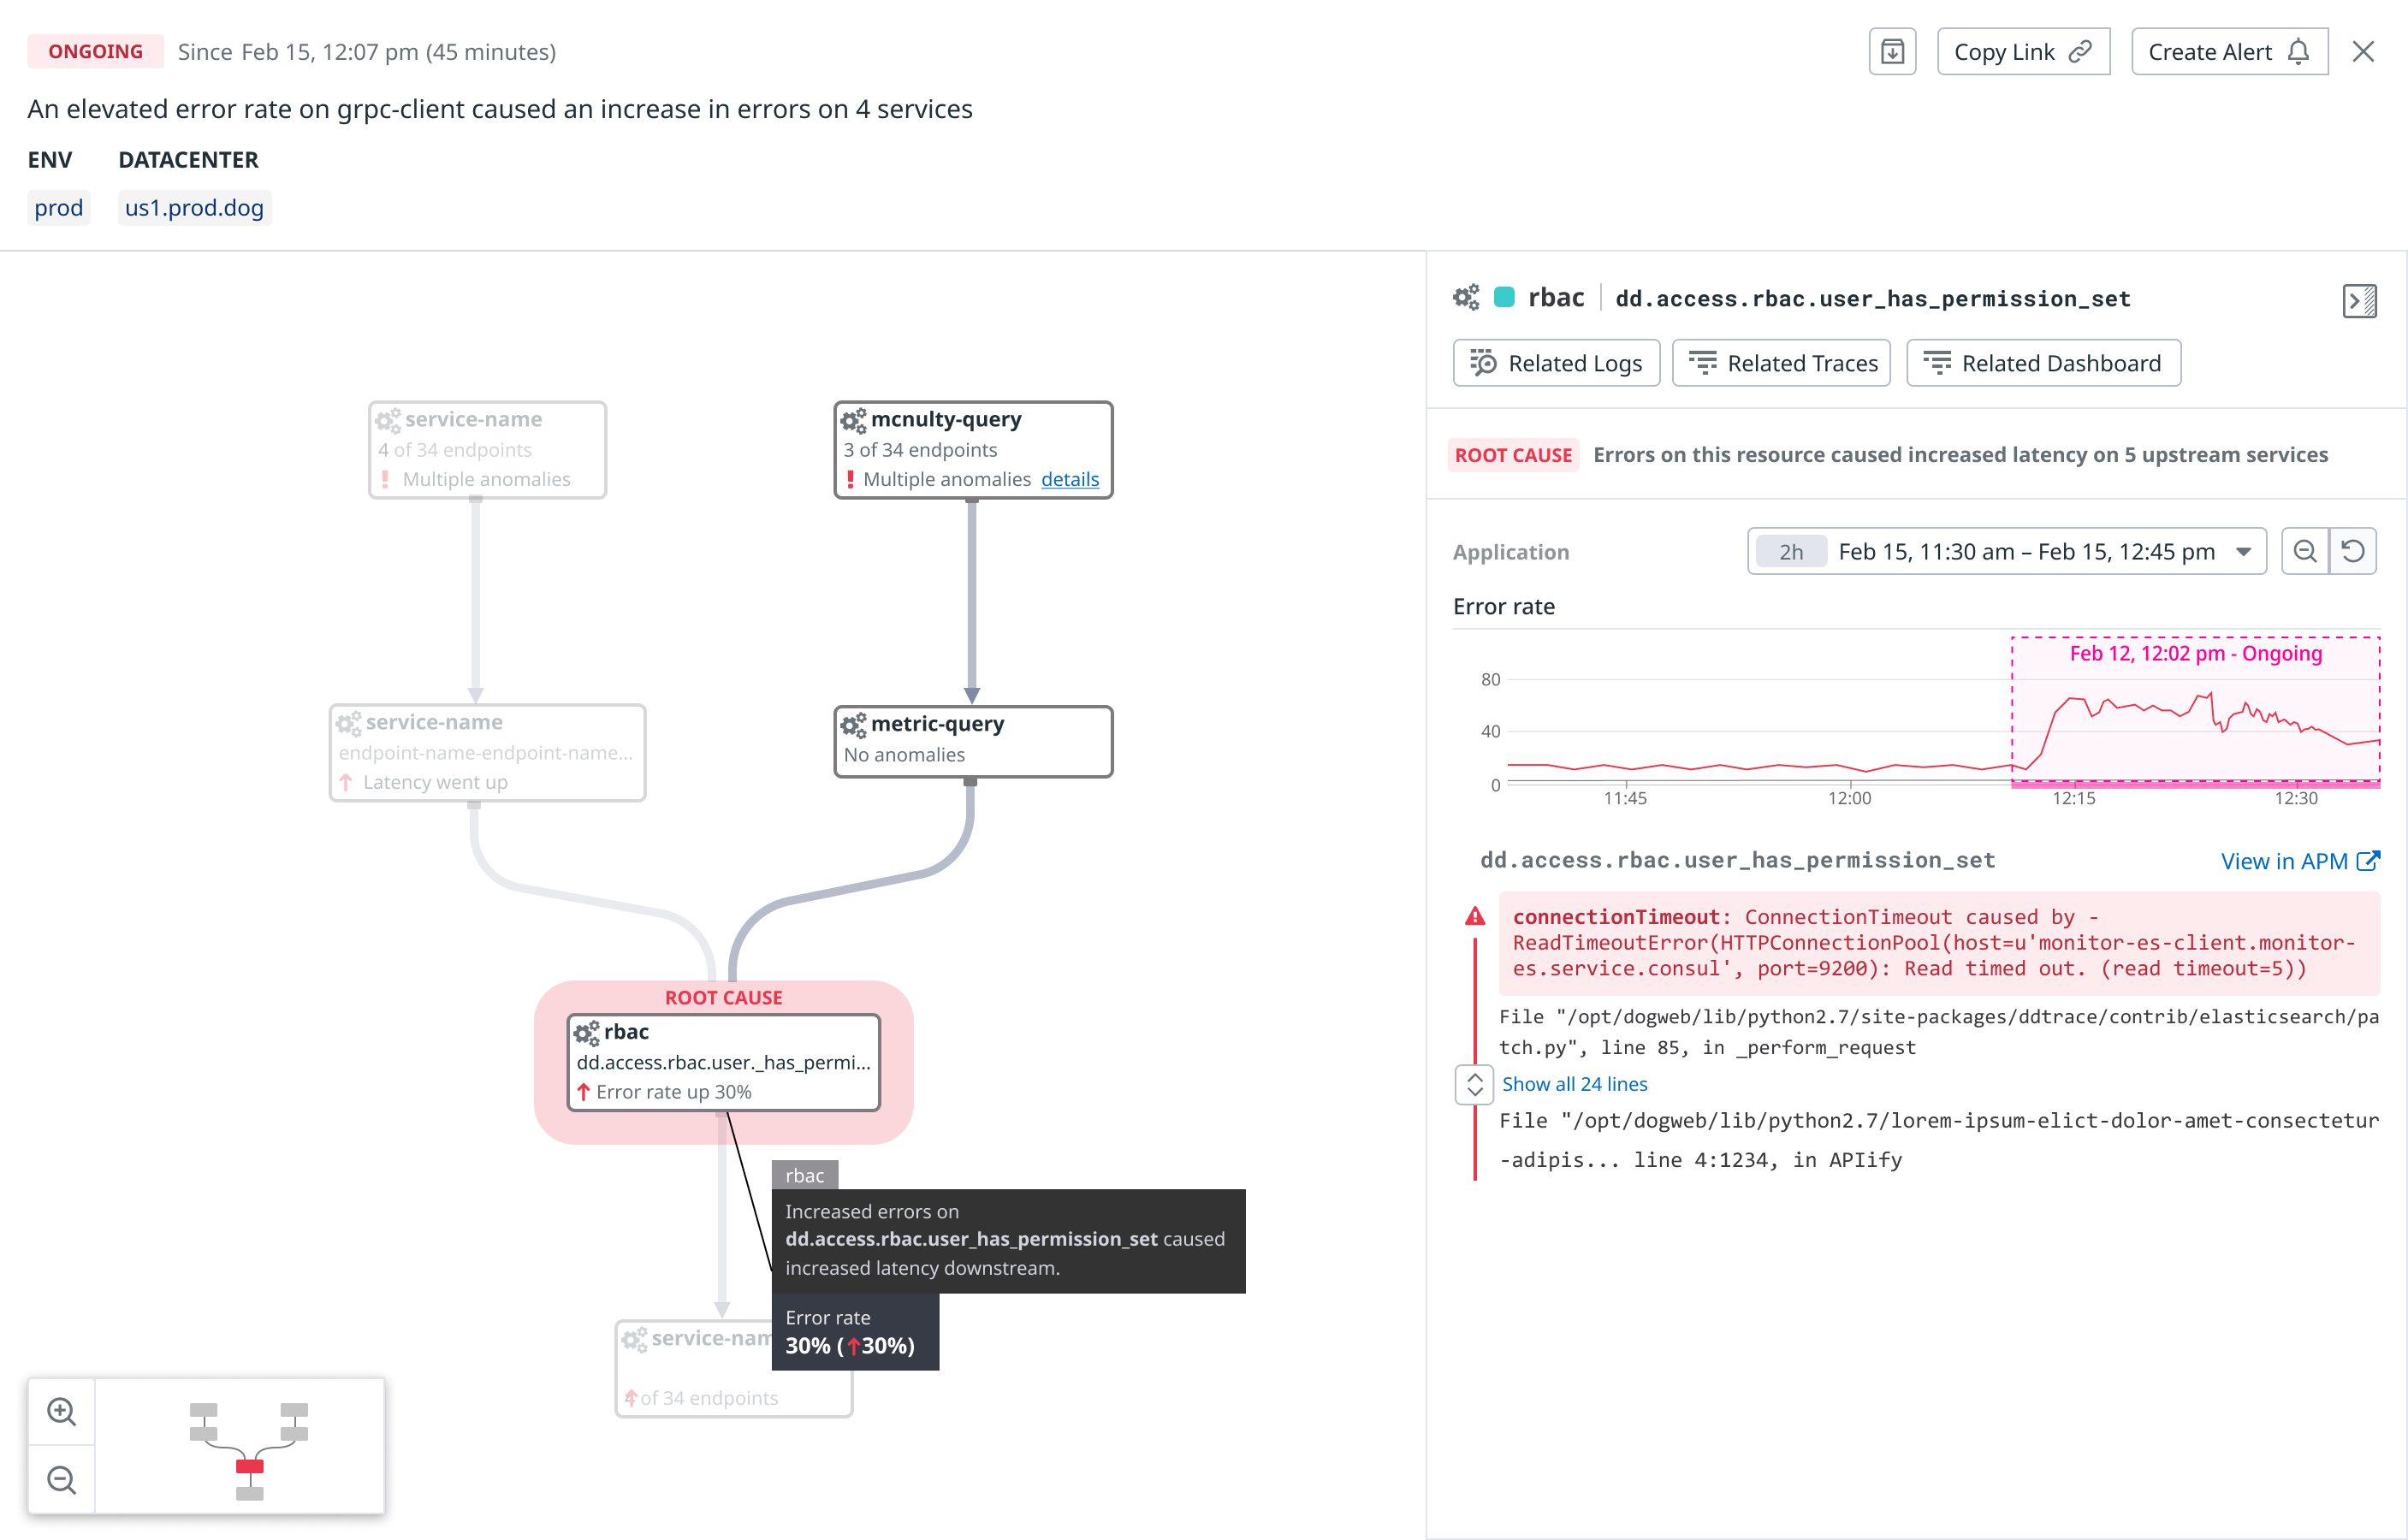
It made relationships more visible, but it exposed some deeper issues:
Incidents could involve hundreds of nodes, and teams disagreed on what the relationships should mean. Some wanted arrows to imply causality; others used them to mean “upstream,” a term that itself lacked a shared definition.
The Applied AI team was also reluctant to label anything definitively a cause.
I argued that a Root Cause product that never named a cause would undermine trust. The challenge was that the product framing implied more determinism than the model could honestly support. Exec feedback echoed that even with better visuals, the product story was still too ambiguous.
Reframing the output
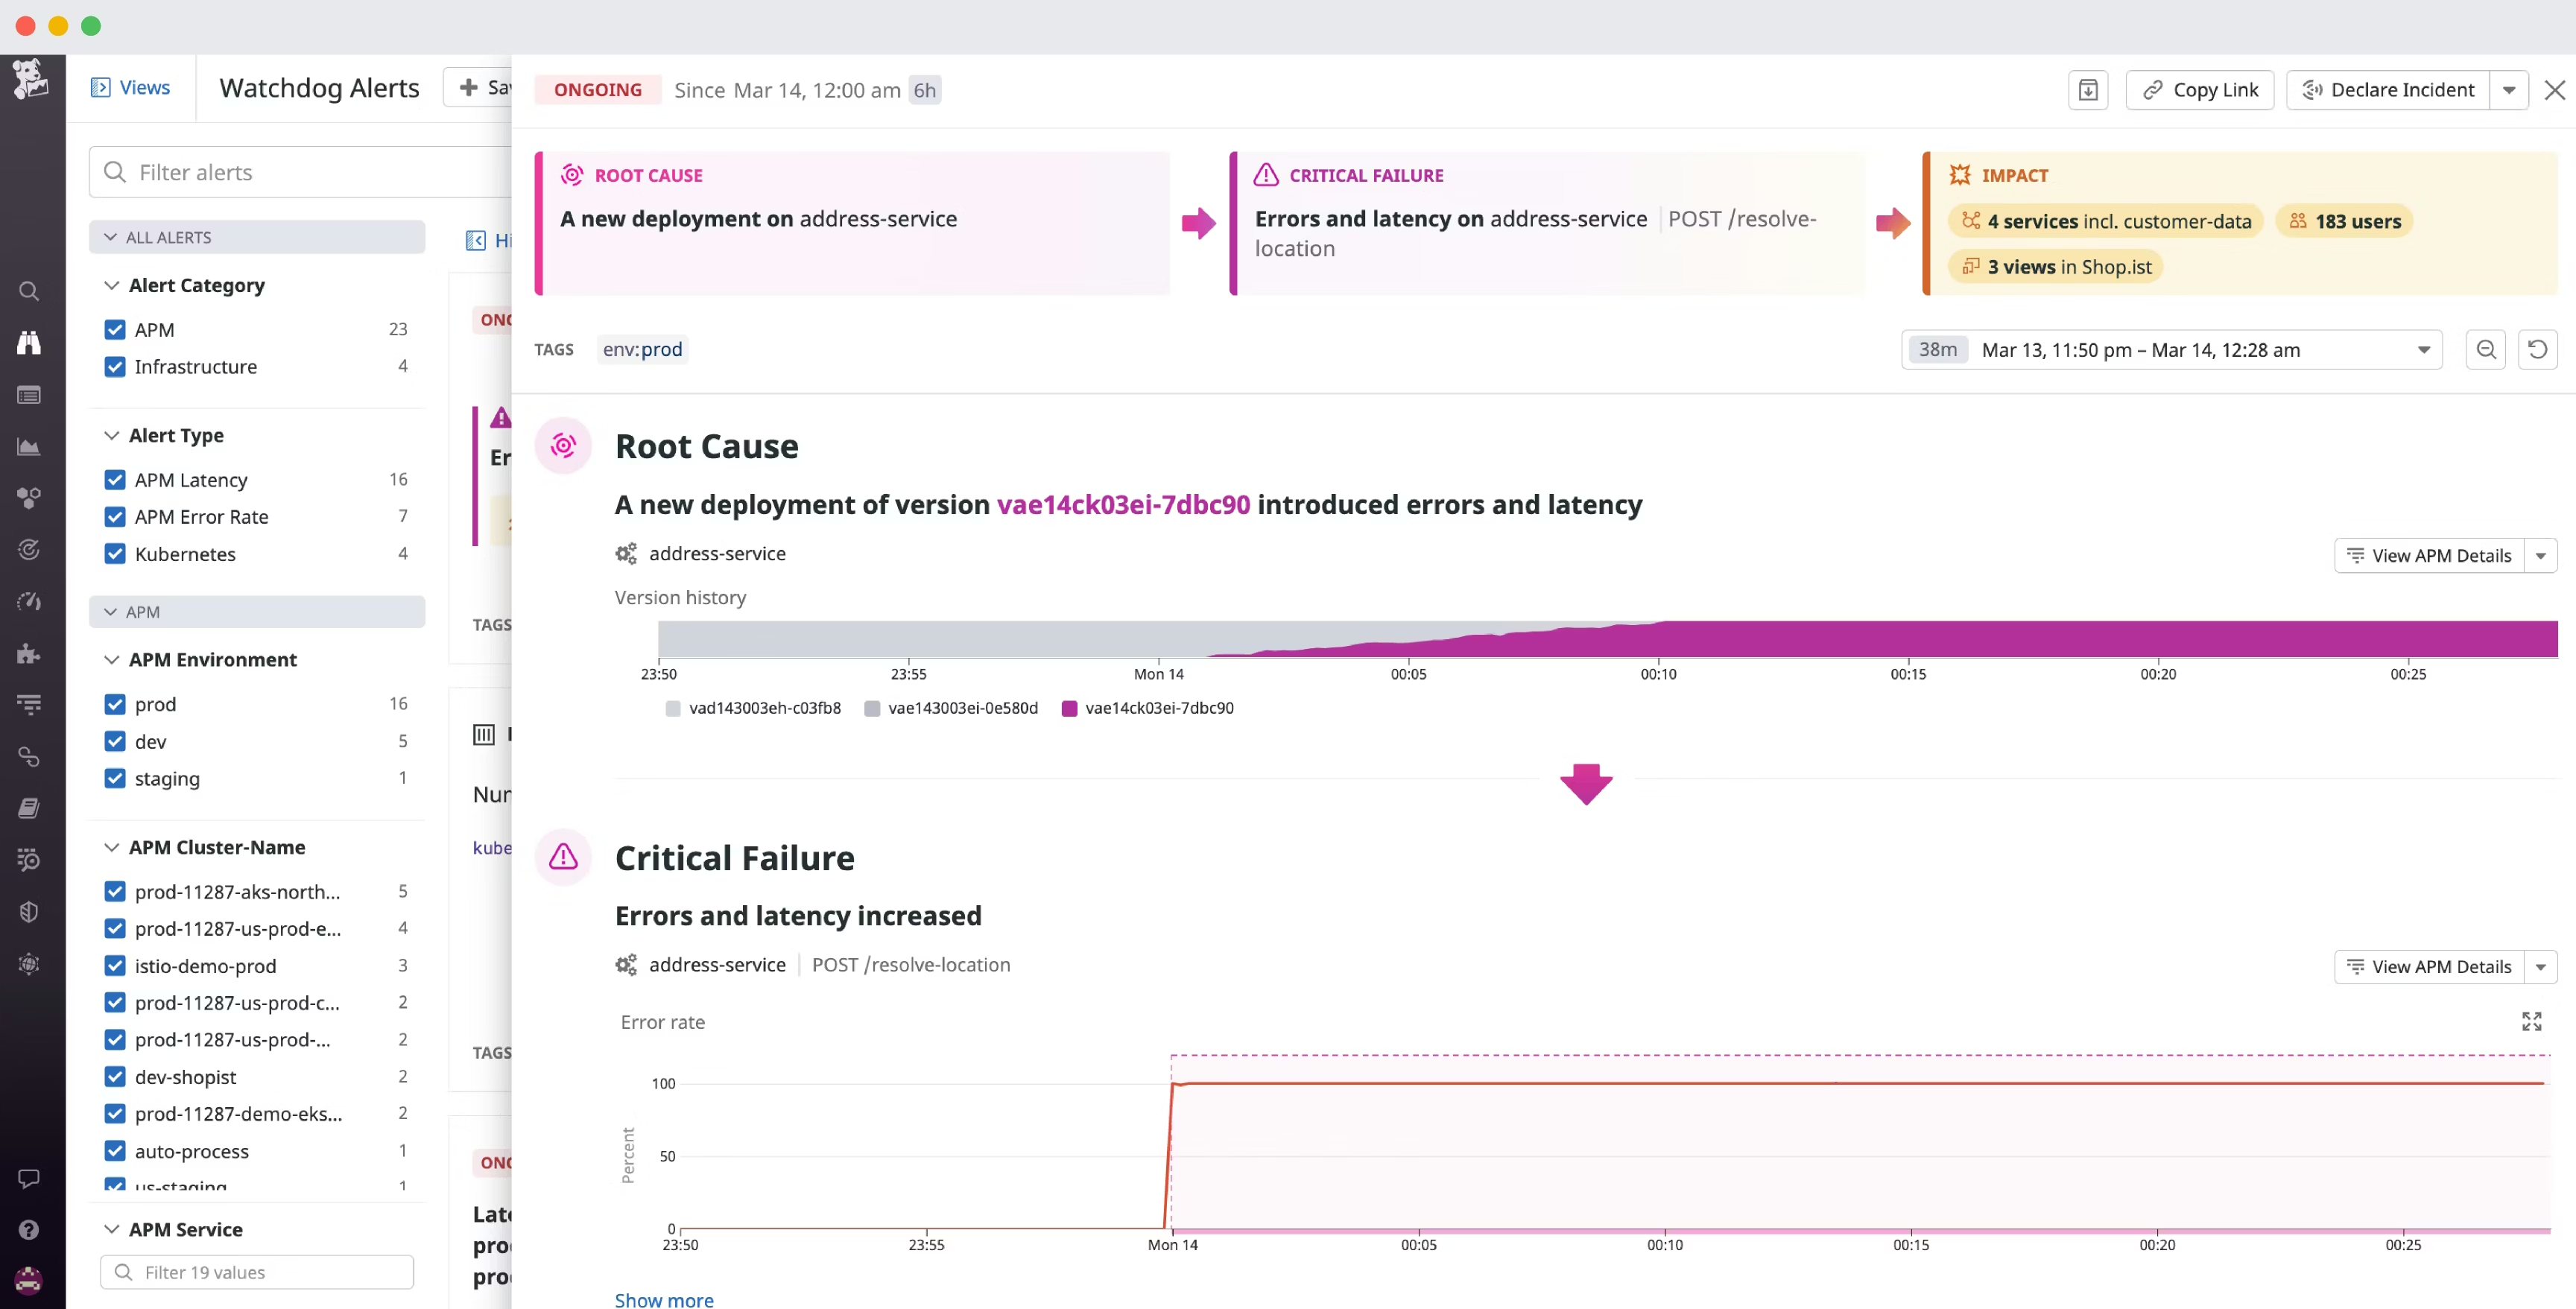
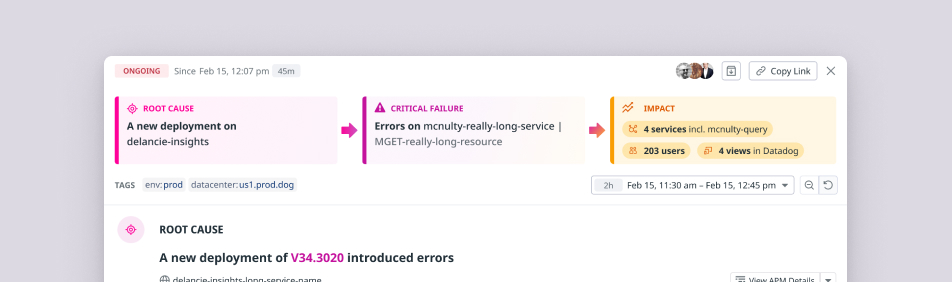
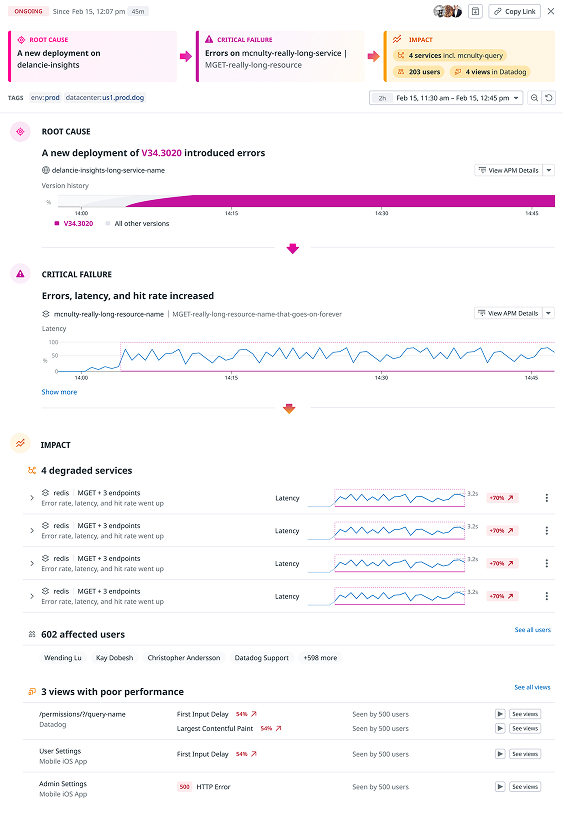
The output itself needed to be actionable for an engineer. I worked with DS lead Stephen Kappel to reframe it into three buckets:
- Root cause — the initiating state change
- Critical failure — first observable degradations
- Impact — a long tail of downstream effects
This reduced noise by pushing most correlations into “impact,” and turned what was once a graph collection into an incident narrative engineers could scan and act on immediately.
The final experience combined narrative prioritization with supporting evidence, so engineers could understand the incident at a glance and still inspect the underlying data when needed.
Scaling the system
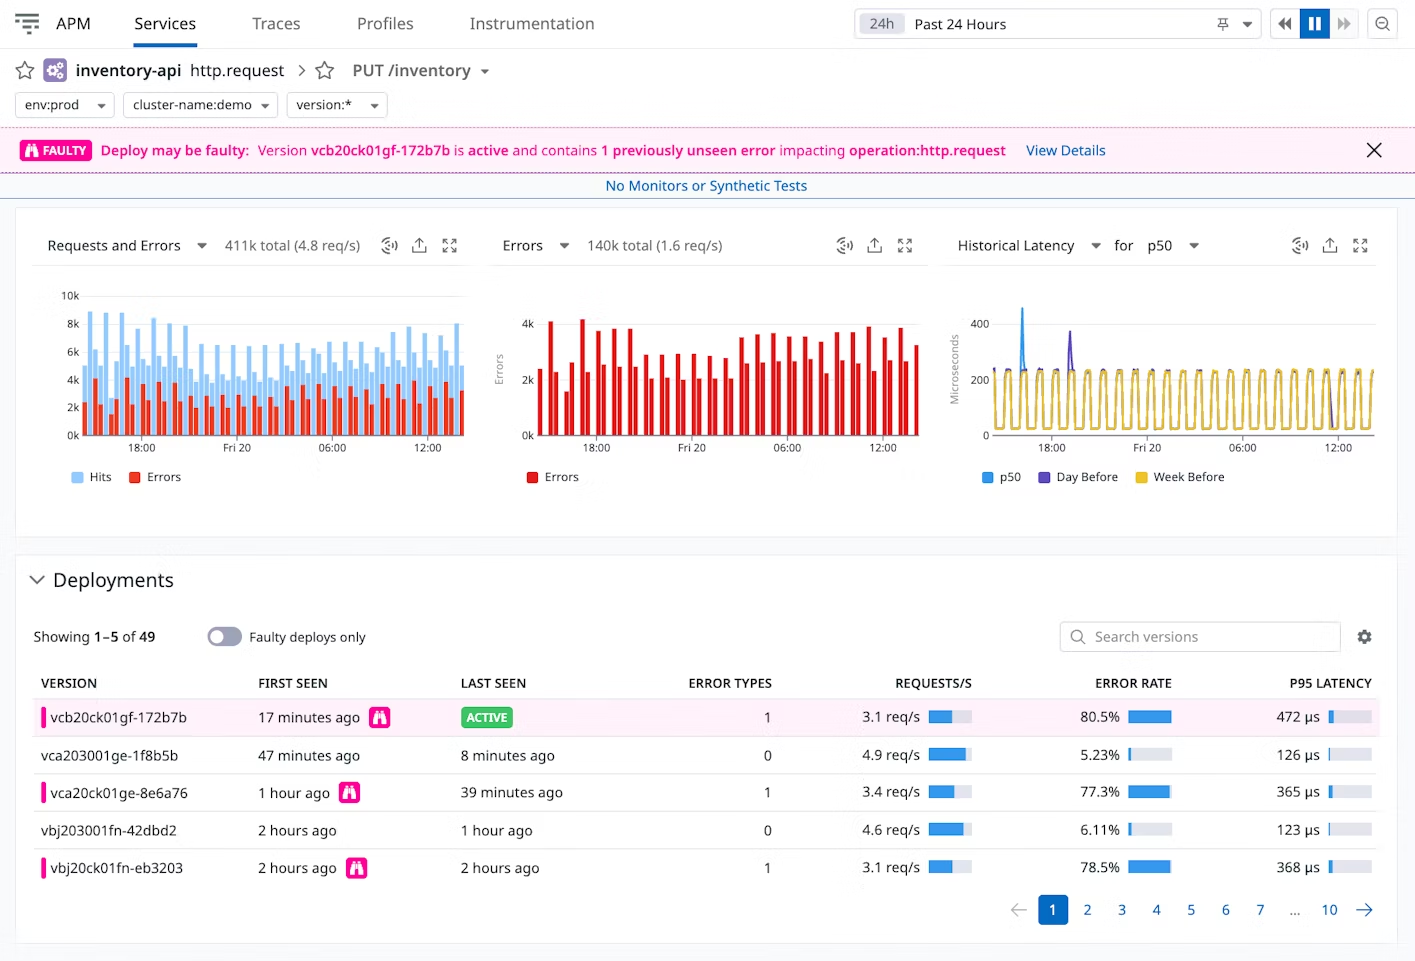
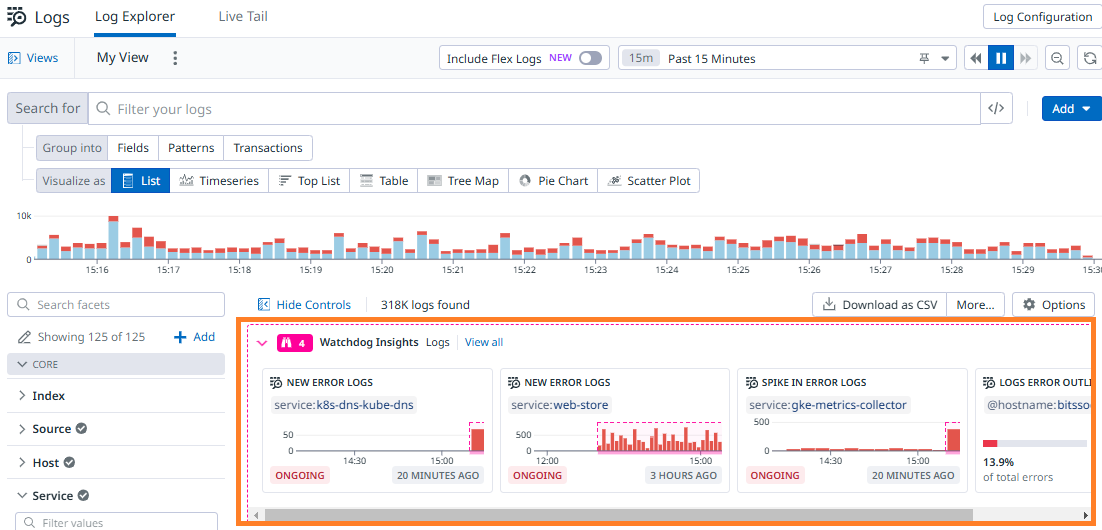
The same principle guided the broader system: every insight should imply a clear next question or action for the engineer. I designed reusable insight patterns and components, and partnered with other product teams to adapt them into the right product contexts, including Datadog’s biggest products: APM, infra, and logs.
This shifted Watchdog from a standalone feature into a cross-product layer for surfacing insights where engineers needed them.
Impact
Watchdog RCA helped reduce incident resolution from hours to minutes. Site Reliability Architects described it as part of their teams’ daily workflow because it focused attention on the signals that mattered most. Later that year, Datadog was named a Forrester Wave Leader in AIOps.